Farm Trials

Waikato 2007 Herd/Herd

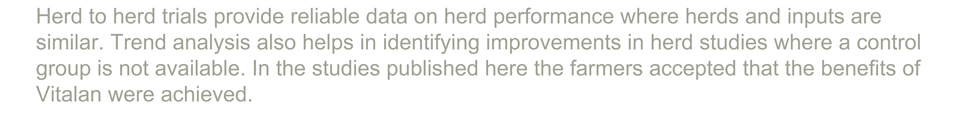
A herd to herd study in Waikato ran from 1st Jan to 8th March in 2007. The study compared the performance of similar breed and sized herds of 585 and 610 cows on adjacent farms. Dosing started on 10th January and was continued for 56 days. The month of January was very mild, overcast with high ground moisture and good pasture growth. There was very little difference in the performance of both herds during the month of January. In late January the summer arrived with hot dry sunny conditions. The herd that was dosed maintained much better daily production and this trend continued through to end of dosing.
Bay of Plenty 2008 Drought

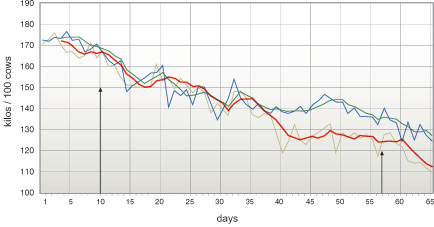
A herd of 220 cows in the Bay of Plenty was monitored through February and March of 2008. This was a drought affected area and production throughout the region had started to decline in January more rapidly than is usual. Vitalan dosing started on 22nd January and significantly reduced the rate of production loss. Production was maintained at a consistently stable level from early February through to the end of March despite the continuing effect of the drought.
Canterbury 2008 Drought

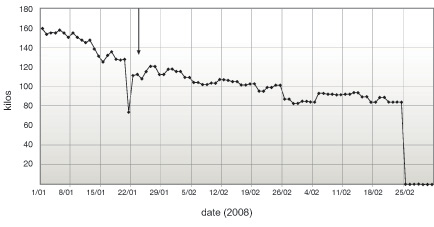
A herd of 260 cows in Canterbury started using Vitalan on 21st February 2008. Drought conditions had already started. The immediate result was that production loss was slowed and steadily gained over the next month. Production in early April was near to that at the start of dosing.
Temuka 2007
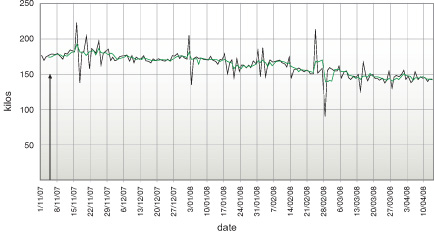

Dosing started with a herd of 550 on 3rd November 2007 and has continued throughout the season. Production has been maintained at a consistently high level throughout the summer and dry spell. The result needs little further comment.
Otago 2008
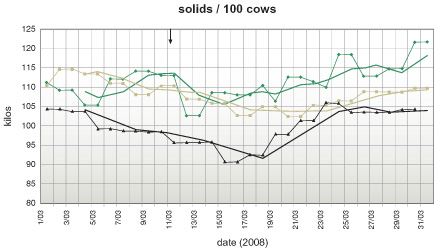
A herd to herd study ran from 12th March to 31st March 2008. The farms are in close proximity. Production performance was comparative in the early days of study. The treated herd increased at a much greater rate than the control. The difference between the groups rom 16th March to 13th March is just over 7% in solids.
